The manufacturing industry has benefited greatly from technology over the years. Companies can now receive orders electronically and invoice more quickly. Moreover, with data collecting sensors, businesses can predict maintenance of and replacements for critical equipment to avoid downtime. All of this data helps companies to be more efficient. When it comes to creating a manufacturing budget and forecast solution, data is just as critical. With more data available than ever before, the right tools can create accurate manufacturing budgets and may even accelerate a company towards their goals.
This post concludes our new four-part mini-series on our blog, in which we teach you how to unravel manufacturing forecast solutions and master them for your business. We have established controls, formed demand planning, and discussed the importance of headcount utilization. In this final post, we teach you how to create an accurate budget.
Data leads to better decisions
Every year, companies make an annual budget to help them plan for the upcoming year and make the necessary adjustments to cover expenses. For manufacturing companies, this means determining the amount of raw materials, headcount, and energy needed to produce next year’s projected demand. Further, you will need to determine certain high-impact production processes within manufacturing sites for each family of products, since these costs can greatly impact the overall bottom line.
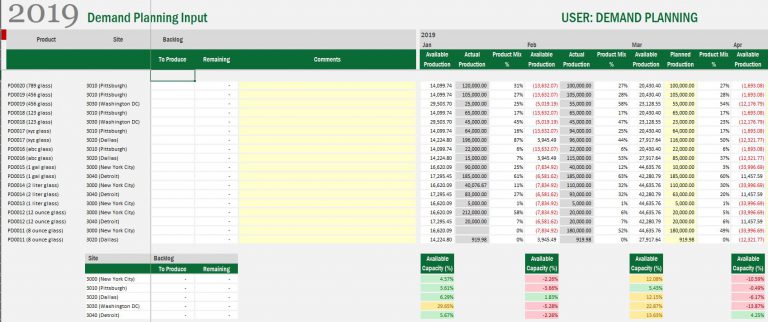
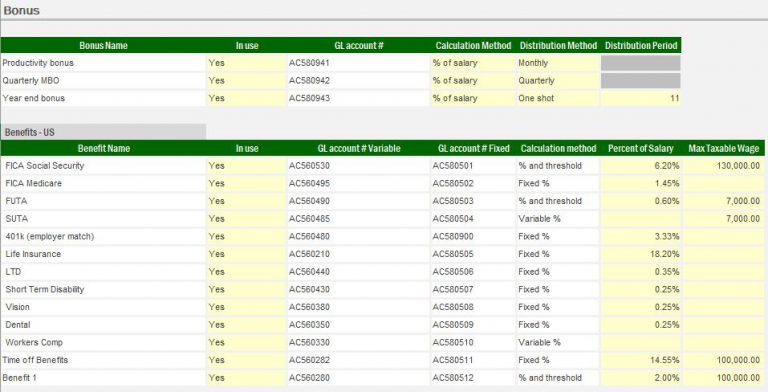
If you have been following through this blog series, Finance can now, based off real, accounted-for demand, input received from Human Resources and the Manufacturing Plant. And Demand Planning can make meaningful Budget and Forecast Solutions to drive business decisions.
Less is more
In my previous company, our budget file had over 200 input tabs within excel. Not every tab was utilized, but that was just one site. There were 17 manufacturing sites total, and each one linked to a market segment roll up file for complete company review. Demand schedules changed, new rates from HR came in. And we kept wondering, is this the latest version? Are formulas overridden?
None of this was malicious, but you can imagine the headaches that came from manually going back and updating the information. I managed four different sites (one of them was a green-lit start-up with zero historical data to draw from, and two were being decommissioned). The new site went through construction delays, which pushed many other schedules back. In turn, the two decommissioning locations had to run longer than intended, and this caused problems with labor union restrictions.
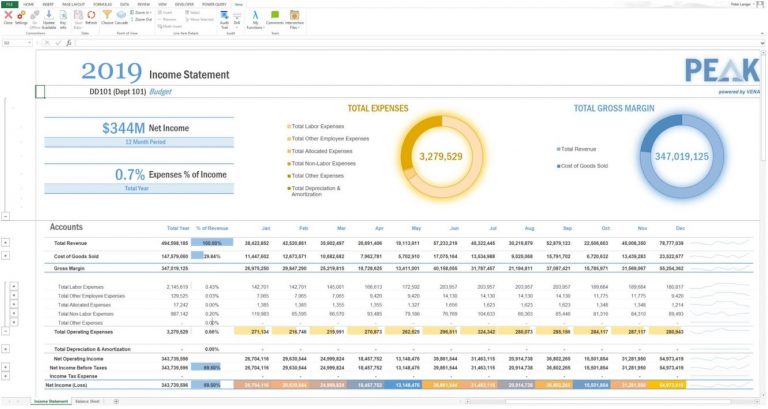
In contrast, this budget file is in one singular tab using a combination of Vena flags, if statements, and the choose function. By leveraging Vena’s other tools, like lock check rows/columns for cell protection, the risks of overwriting formulas and questioning the data’s integrity are removed.
Attention to detail
As many of you budget and forecast certain expenses, it may look like the Operating Supplies example below. At first glance, it may leave a reviewer wondering why March was forecasted so much higher. Did the user ‘fat finger’ the input? On the other hand, maybe the planned expense is justifiable. Either way, though, we wonder.

However, with the Vena line item detail enhancement, the user provided more information (see Figure 2). This helps prevent confusion, so that no one is second guessing what makes up that figure. Consequently, this reinforces confidence in your Budget and Forecast Solution.

As the user continues to budget and forecast, through a series of drivers, they can cater their solutions accordingly. This well-organized structured flow allows you to take key metrics from other departments that have gone through the approval process and move forward. For example, I used to budget once a year for utilities and re-forecast on a monthly basis. Rates fluctuate! This gives the user the ability to fine-tune and get more efficient with overall operational effectiveness. Users can see previous months’ actuals on KWH and MCF usage and perform a straight-line calculation or make an adjustment. Or maybe just use a prior year average.
Learn more about Vena’s line item details:
Execution and control
In a hidden tab (because the data’s already pulled), an interactive comparison allows the user to see how the plant performed last month, quarter, or year, as well as data type (i.e. budget versus previous forecasts). With Vena’s ability to store, aggregate, and combine data, users can now use the results to perform deep dive analysis to not only exploit potential issues, but to explore as well.

Successful Manufacturing Forecast Solutions depend on businesses constantly finding new ways to streamline their operations. In the past, this meant spending months examining every single process, testing and re-testing innovative ideas, and finally implementing changes. However, this outdated mindset can sink manufacturers before they gain the opportunity to make improvements.
Strategy for success
Scenario planning can be critical to cost-savings, as well. You can adjust manufacturing budgets via the results of what-if scenarios. For example, the offer from a vendor to provide materials at a reduced rate based on a significant increase in items ordered. So, how do you improve operations more quickly and efficiently? Manufacturing dashboards and analytics can streamline your operations by giving you more focused and actionable insights that help you continuously fine-tune your production line.
Real time adjustments
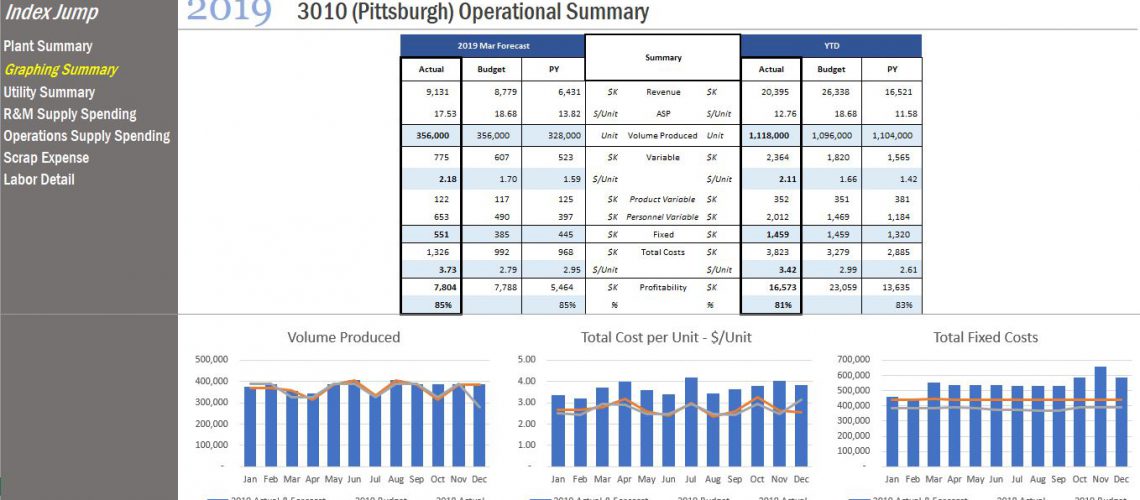
Reporting is a critical tool to properly understand your company’s day-to-day operations. That’s why the plant management book is set up similar to an actual book. When I first created it, I put myself in the plant manager’s shoes wondering how the plant was performing without having to run a ton of individual reports. This allows users to review and focus on plant efficiency and efficacy in one centralized location.

Moreover, it gives the user a CFO-like view, where they can analyze and interpret the action/reaction of everyday production. The graphing summary links to a power point deck. So, as changes are saved back, Performance Management Reports and presentations can adjust your story board on the fly accordingly.
To learn how to connect to PowerPoint, check out our tutorial below!
Collaboration = Opportunities
To summarize, collaboration results in better communication. This, in turn, can help you optimize the budget and forecast solution. If manufacturing shows an increase in cost based on budget inputs, the sales team must have that information sooner rather than later to make appropriate adjustments in the budget. The right solution can harness data that companies generate daily. Only a BI strategy and Manufacturing Forecasting Solution will allow them to excel. With my old company, there was a feeling that we were constantly fighting each other. Here’s the weapon to fight together. Are you ready to use it?
Read More >> The Art of Business Intelligence


