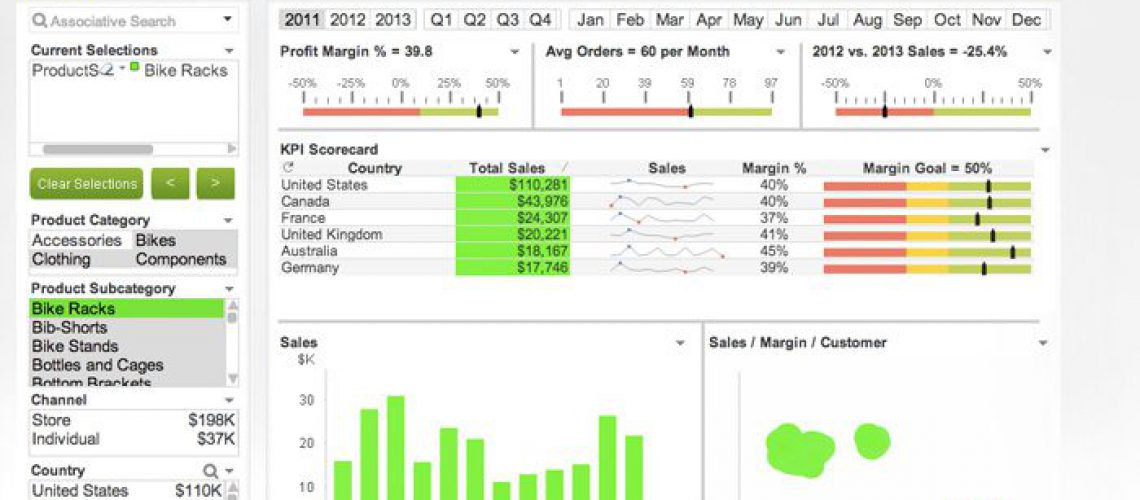
QlikView’s appeal and power is behind its ease of use and the speed at which users can perform data discovery without the need to bother IT with requests. Once an application is validated and deployed, business users have the ability to perform their own custom reporting needs quickly.
But what if it’s not quick? Then some optimization and fine tuning must be done!
There are plenty of ways to fine tune a QlikView application, but I want to focus on 4 that should be performed immediately.
- How large are your charts?
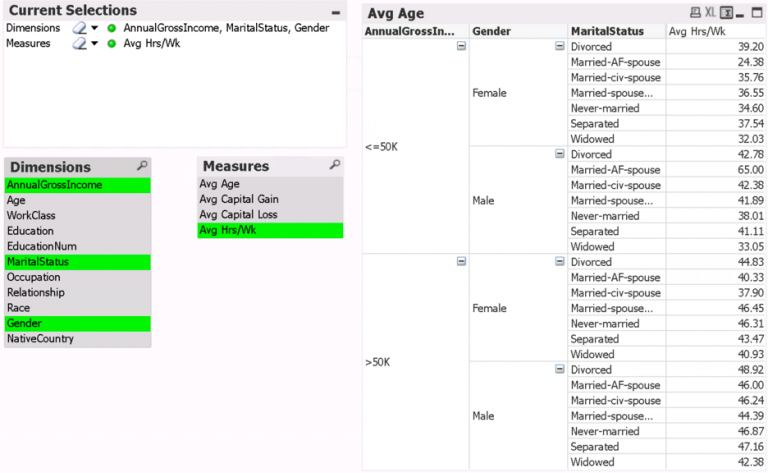
If you have a detailed straight table that contains hundreds of thousands or millions of lines, you may want to consider applying a calculation condition that will require users to make selections that limit the line count. The way I normally try to accomplish this is by identifying one field that I want to limit, normally the Invoice Number, Account Number, etc. I then create a condition, for example, Count(InvoiceNo) < 50000. When there are more than 50,000 invoice numbers in the current filter, my chart won’t load.
This is also helpful in limiting how many records a user can export to Excel.
Reminder: Make sure to set an error message to accompany any Calculation Condition. You want to specify WHY the chart isn’t being loaded, or risk confusing the users.
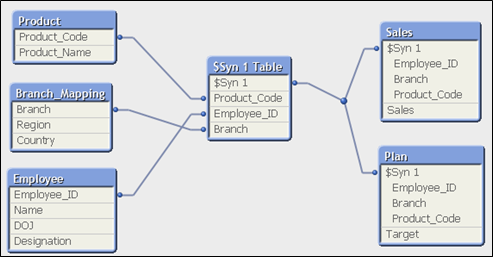
- Are there any synthetic keys in your model?
While QlikView can handle some synthetic keys, it has a tendency to slow the application down. QlikView can handle the links better if you code it in yourself, using functions like:
- AutoNumber(Field1,Field2)
- AutoNumberHash128(Field1,Field2)
- AutoNumberHash256(Field1,Field2)
- Concat(Field1,Field2)
All of these functions will allow you to create the key in the table, rather than letting QlikView try to identify and create a key synthetically.
- How many IF Statements are in your data?
QlikView is quick because it loads all of the data straight into memory, the way it appears from the data source (preferably a QVD). What happens if you start changing the way the data appears from the way it’s loaded in? It slows down. One of the reasons it slows down is because every time a new filter is applied, QlikView has to recalculate all of those changes for every line. Imagine 5 changes per line, and 5 million lines… that’s quite a bit of calculating that the application must do every time a new filter is applied.
To speed up your application, you want to avoid doing these sorts of changes in the application, and instead make the changes in the script.
But what if you can’t put these changes in the script? Then try to utilize Set Analysis as much as possible. This is QlikView’s answer for the times that it can’t be avoided. Create flags or buckets in your script then refer to them in Set Analysis. The application will run much faster.
What if you want to change the calculation based on selections? You can still avoid the IF statement by using ‘Conditional’ shows. You can put each expression in with a ‘Conditional’ show using the function GetFieldSelections(Field1) = ‘Value’. When Field1 is on the specified value, that expression will show while the other expressions will not. This technique can also be used for the entire chart or sheet.
- How large is the application?
If your application size, in conjunction with your user adoption rate, exceeds the formula that Susie Bann explained in her blog post, it is recommended that you begin looking to upgrade your server, or breaking the application into multiple, specialized QVW documents.
I often look to break the application into main categories that each business department finds useful, such as Finance, Inventory, Sales, etc. This allows for only the needed amount of data to load into the cache per user, and thus limits the required amount of memory needed for successful deployments.
These are a few suggestions I recommend you take immediately to optimize your QlikView application experience. Your users will thank you!


